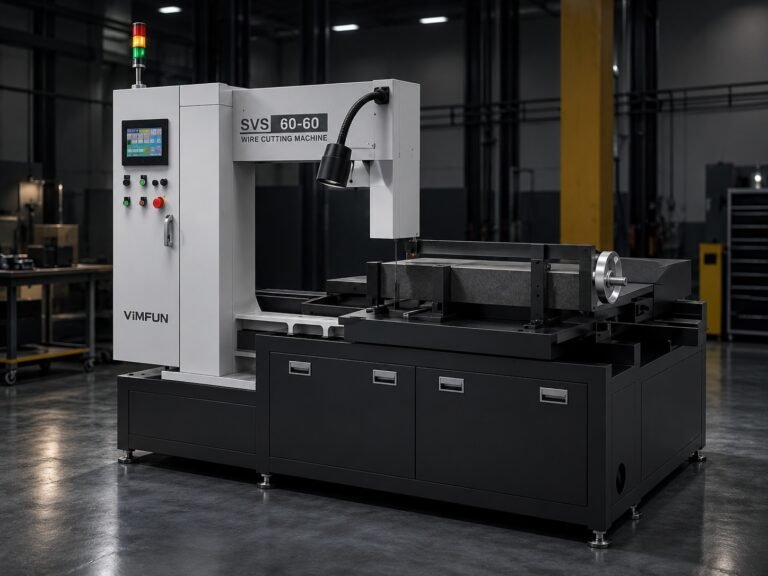
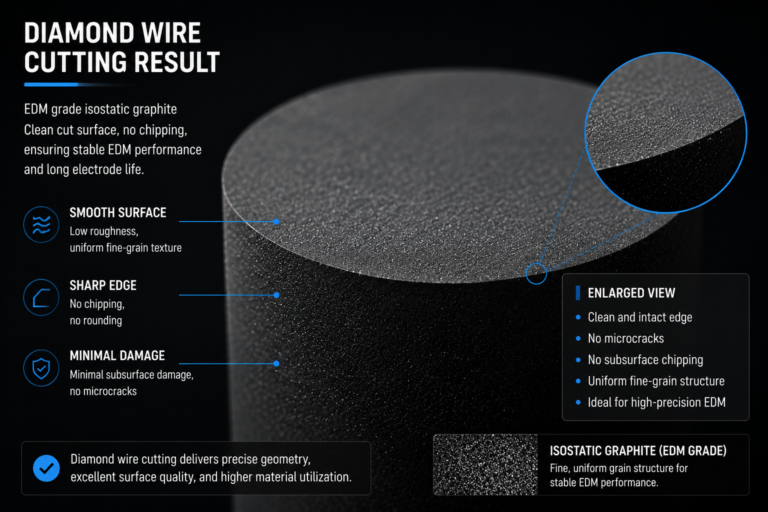
On a 500 × 300 mm block of high-purity isotropic graphite, every additional 0.1 mm of kerf across 20 cuts translates to roughly 200 mm³ of unrecoverable material—material you already paid for, and material that shows up as scrap in your monthly cost review. In high-value grades, that is not a rounding error. It is a line item.
Yet most operations trying to reduce kerf loss reach for the wrong lever first. They swap in a thinner cutting tool, run a few test cuts, see a small improvement, and stop. The problem is that tool width is only the visible part of kerf—the rest is process-induced spread that a thinner tool cannot fix by itself, and sometimes makes worse.
This guide walks through the five factors that actually determine kerf loss in graphite cutting: what each one does, how they interact, and where the practical limits are. If you want the broader cost and yield perspective on why kerf matters in the first place, see the Pillar 4 overview on low-kerf graphite cutting. This page is the operational companion.

What Determines Kerf Loss in Graphite Cutting
Kerf is the width of material removed by a single cut. In practice, measured kerf is always wider than the nominal tool width, because the cutting process introduces its own contribution—vibration, path deviation, edge chipping, and thermal effects at the cut face. The gap between “tool width” and “measured kerf” is where most of your controllable loss lives.
Reducing kerf loss is therefore not a single-variable problem. It is a system problem. The five factors below are ordered roughly by how often we see them ignored, not by absolute importance. In most graphite operations, batch consistency (Factor 5) delivers more real savings than tool width (Factor 1), even though tool width gets 90% of the attention.
Factor 1: Cutting Tool Width and Stability
Tool width matters, but stability during the cut matters more. A 0.20 mm cutting tool that deflects to an effective 0.28 mm under load produces the same kerf as a 0.28 mm tool that stays straight—except the “thin and unstable” version usually has worse edge quality and shorter tool life.
When evaluating a cutting tool for kerf performance, look at three specifications together, not one:
- Nominal width (the number on the spec sheet)
- Deflection under working load (rarely on the spec sheet—ask, or test)
- Wear pattern over service life (does the tool widen uniformly, or does it develop uneven zones?)
The common mistake is to select the tool with the narrowest nominal width and assume kerf follows. It does not. A tool with 15% wider nominal width but half the deflection can produce a narrower and more consistent kerf across a full production run.
A practical rule from operations: if you cannot measure your tool’s deflection under working conditions, you should not assume it matches the spec sheet. Deflection data from a bench test at room temperature tells you very little about behavior during a two-hour cut on a warm machine.
Factor 2: Feed Rate and Cutting Path Control
Feed rate has a non-linear relationship with kerf. Push too slow and you build up heat, which widens the effective kerf through thermal spread. Push too fast and you introduce vibration and edge chipping, which also widens kerf. The optimum is a band, not a point.
Path control is the less obvious half of this factor. Even at optimal feed, a cutting path that oscillates laterally by ±0.05 mm produces an effective kerf that is 0.1 mm wider than the tool—regardless of how narrow the tool actually is. In long cuts on large graphite blocks, path deviation is often the single largest contributor to kerf loss.
Diagnostic sequence when kerf is drifting:
- Measure kerf at the start, middle, and end of a single cut
- If kerf widens toward the end → thermal drift, reduce feed rate or improve cooling
- If kerf varies mid-cut without a trend → path stability issue, check machine rigidity and any lateral load
- If kerf is uniform per cut but drifts across a batch → tool wear or fixture shift (see Factors 3 and 5)
This sequence takes 20 minutes on the shop floor. Skipping it and instead spending three days evaluating new tools is a common mistake.
Factor 3: Material Fixture and Vibration Damping
Graphite is stiff but brittle. A fixture that cannot suppress workpiece vibration during the cut will produce kerf variation that no tool selection can compensate for. In our experience, fixture-induced kerf noise is roughly 2–3× more common than tool-related kerf variation, and it is almost never the first thing operations check.
The fixture failure modes worth watching:
- Insufficient clamping stiffness on large blocks—the block flexes microscopically against the cut and the kerf tracks the flex
- Point-load clamping rather than distributed clamping, which allows local rotation
- Fixture wear over time—clamping surfaces develop marks and lose contact area, which increases with fixture age
For small parts, the reverse problem appears: excessive clamping force can locally deform soft graphite grades, again shifting the effective kerf. There is no single “right” clamping force—it depends on part geometry, graphite grade, and the cutting direction relative to the material grain.
If you inherit a fixture with a job, do not assume it is optimized. Run a kerf comparison against a temporary rigid setup before accepting the fixture’s performance as baseline.
Factor 4: Coolant and Lubrication Strategy
Coolant does two things for kerf control: it removes heat that would otherwise widen the effective cut through thermal expansion, and it flushes cutting debris that would otherwise re-enter the kerf and widen it through secondary abrasion.
Dry cutting is possible for graphite and is often used for cleanliness reasons—the resulting powder is easier to collect than a slurry. But dry cutting almost always produces measurably wider kerf than wet cutting on the same material, typically by 5–15% depending on cut length and speed. If your operation is dry for downstream contamination reasons, that trade-off is legitimate. If it is dry because “graphite doesn’t need coolant,” you are paying for that assumption in kerf.
For wet cutting, the two common mistakes are:
- Wrong coolant flow direction relative to the cutting path—if flow does not clear debris from the kerf, debris re-cuts the kerf face
- Insufficient flow rate for the cut depth—coolant needs to reach the working zone, not just spray near it
Coolant selection itself matters less than most people think, once you get flow and direction right. Most operations we see are running an adequate coolant with inadequate delivery.
Factor 5: Process Consistency Across Batches
This is the factor that most operations discover last, and it is usually the one that returns the most savings. Reducing average kerf by 10% is worth something. Reducing kerf standard deviation across a 100-part batch by 30% is worth substantially more, because it directly translates to lower scrap rate and tighter downstream nesting.
Kerf drift across a batch comes from three sources:
- Tool wear—the cutting tool widens gradually and predictably
- Fixture drift—clamping surfaces shift micro-amounts as the fixture warms
- Coolant degradation—cutting fluid picks up debris and its effective cooling changes
The correct response is not to “fix” each source individually the moment it starts affecting kerf. That is a losing game. The correct response is to build a process that tolerates drift by:
- Establishing a kerf baseline on Part 1 of the batch
- Sampling kerf every N parts (typically every 10–20 depending on batch size)
- Setting a drift threshold that triggers action (tool change, coolant refresh, or fixture check)
- Documenting when each trigger fired, so you build a data set on real-world drift rates
If you only have time to implement one thing from this entire guide, implement step 3—a defined drift threshold and a documented response. This alone typically reduces batch-level kerf variance more than any tool change.
For a deeper look at how batch consistency translates into yield numbers, see the yield-focused companion page on graphite cutting yield improvement.
What to Measure and How to Track Kerf Reduction
You do not need coordinate measuring machines or optical profilometers to establish useful kerf baselines. A calibrated digital caliper or a low-cost optical comparator is sufficient for most graphite operations, provided you measure consistently.
The three metrics worth tracking:
- Mean kerf per cut—the average width across a single cut
- Kerf standard deviation within a cut—how much kerf varies along the length
- Batch kerf standard deviation—how much the mean kerf varies from part to part across a batch
A weekly review of these three numbers, plotted against tool age, coolant age, and any process changes, is worth more than a monthly review of a dozen additional metrics. Complexity is not what improves kerf. Consistent measurement is.
One practical suggestion: track kerf on a wall chart, not just in a database. A visible chart on the shop floor changes operator behavior in a way that a database report does not. The measurement discipline reinforces itself when it is visible.
When Not to Chase Lower Kerf
Not every graphite operation benefits from aggressive kerf reduction. If your part cost is dominated by machining time downstream, and the material cost per part is a small share of total cost, then reducing kerf by 20% may only reduce total cost by 2–3%. That is real, but it may not justify the process investment.
The operations that benefit most from serious kerf reduction share three characteristics:
- Material cost is a significant share of total part cost (typically 30%+)
- Batch sizes are large enough that consistency matters
- Downstream processes cannot easily recover from kerf variation (i.e., there is no forgiving finishing step)
If you match all three, this guide’s factors apply directly. If you match only one, be careful about how much you invest in kerf reduction versus other yield levers.
Related Reading
- Low-Kerf Graphite Cutting: Material Loss, Yield, and Manufacturing Cost Impact — the cost and economic perspective on why kerf matters
- Graphite Cutting Yield Improvement — how kerf control connects to overall yield performance
- Material Loss in Graphite Machining — comparing kerf loss to chip removal in machining
- Precision Graphite Slicing — related process for high-precision slicing applications