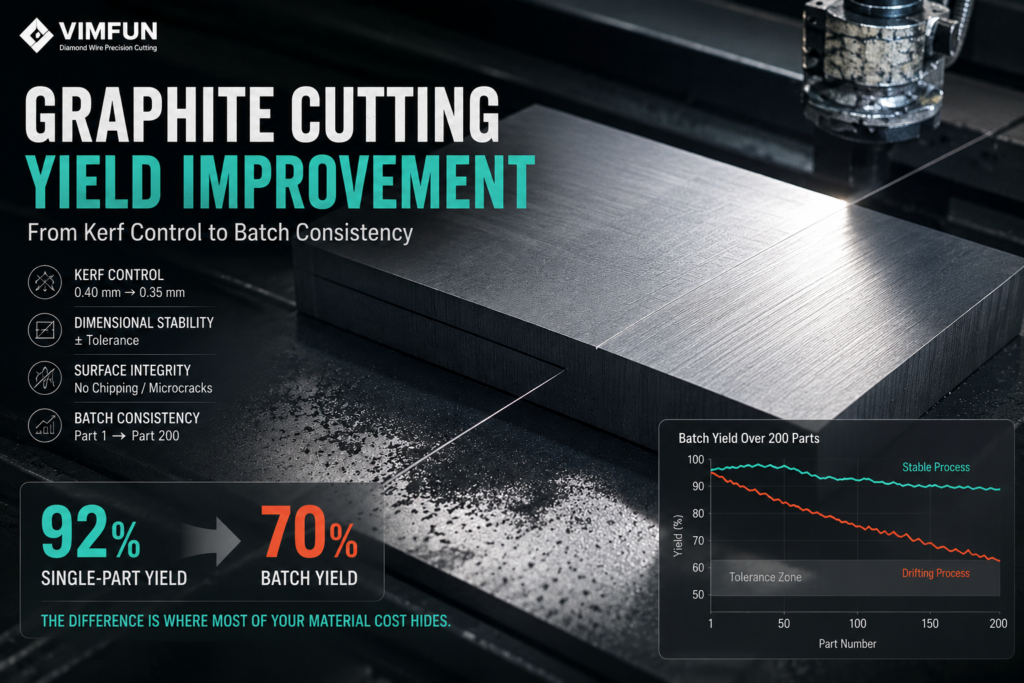
A graphite cutting operation running at 92% single-part yield can easily drop to 70% batch yield across a 200-part production run — the difference is where most of your material cost hides. Graphite cutting yield improvement is not about improving one cut; it is about controlling the variance across every cut in a batch. This page covers why single-part yield never predicts batch yield accurately, the four levers that actually move batch yield (kerf control, dimensional stability, surface integrity, batch consistency), and the diagnostic sequence to use when yield drops instead of blaming material first.
For production and process engineers, 흑연 절단 수율 향상 means treating each yield loss as a signal — kerf drift, dimensional fade, surface defects, or fixture wear — and attacking the largest signal first. The following breakdown assumes you already have a Pillar-level understanding of kerf economics from low-kerf graphite cutting; this page picks up where cost framing ends and outcome measurement begins.
Why Graphite Cutting Yield Is Different from Machining Yield
Graphite cutting yield is measured by usable output divided by starting material volume, and unlike metal machining, the material removed by the kerf itself is a permanent, unrecoverable loss. Machining generates chips that carry no reusable geometry; cutting generates two usable parts separated by a kerf, so every millimeter of kerf is measurable material loss.
This distinction matters because yield in a machining context can be recovered through better tool paths or finer finishing passes. In graphite cutting, once the kerf is gone, it is gone — meaning 흑연 절단 수율 향상 is bounded by both the physical kerf and the process consistency around it.
수율은 재료 활용률과도 다릅니다. 활용률은 부품 형상이 원자재 블록에 얼마나 효율적으로 들어맞는지를 측정합니다. 수율은 이러한 이론적 활용률을 출하 가능한 부품으로 얼마나 일관되게 전환하는지를 측정합니다. 높은 활용률의 설계라도 공정 제어가 제대로 되지 않으면 수율은 낮게 나옵니다.
수율 레버 1: 커프(Kerf) 제어
커프 손실은 모든 흑연 절단 작업의 최대 이론적 수율을 직접적으로 제한합니다. 슬라이싱 작업에서 목표 부품이 5mm인데 커프가 평균 0.4mm라면, 다른 변수가 고려되기 전에 이미 재료의 약 8%가 영구적으로 커프 손실에 갇히게 됩니다.
미묘한 점: 공정이 일관되지 않으면 커프 감소만으로는 수율이 크게 향상되지 않습니다. 평균 커프를 0.4mm에서 0.35mm로 줄이는 것은 커프 개선율 12.5%로 보이지만, 커프 표준 편차가 0.05mm라면(즉, 개별 절단이 0.30mm에서 0.40mm까지 다양함) 치수 변동으로 인해 폐기되는 부품으로 인해 실제 수율 증가는 상쇄됩니다.
커프 제어에 대한 자세한 운영 지침은 다음의 관련 자료를 참조하십시오. 흑연 절단 시 커프 손실을 줄이는 방법. . 흑연 절단 수율 향상, 에서는 커프를 필요하지만 충분하지 않은 레버로 취급하십시오. 줄이되, 항상 일관성 작업과 병행하십시오.
수율 레버 2: 배치 전체의 치수 안정성
치수 안정성은 특히 이미 커프가 제어되고 있는 작업에서 가장 큰 숨겨진 수율 레버인 경우가 많습니다. 첫 번째 샘플 검사를 통과한 절단이라도 공구 마모, 고정 장치 이동 또는 열 조건 변화로 인해 배치 중간에 사양을 벗어날 수 있습니다.
일반적인 실패 패턴: 처음 20개의 부품은 타겟 치수에 엄격한 공차로 맞지만, 100번째 부품까지는 치수가 한 방향으로 0.1mm 이동하고, 180번째 부품까지는 치수 거부 사유가 발생할 정도로 벗어납니다. 첫 번째 샘플 검사에서는 공정이 가능하다고 했지만, 배치 수율은 그렇지 않다고 말합니다.
우리는 고객이 반도체 CVD 서셉터 블랭크용 등방성 흑연 블록을 실행하는 슬라이싱 작업에서 정확히 이 실패 모드를 보았습니다. semiconductor CVD susceptor blanks. First-article measurements looked perfect. The operator ran the batch overnight. By morning, roughly one-third of the parts near the end of the run were 0.08mm oversized — not enough to catch by visual inspection, but enough to fail the downstream grinding allowance. The cause was fixture creep from thermal expansion of the coolant recirculation loop, which we only found by instrumenting the fixture temperature during a repeat run. The fix was a coolant flow adjustment; the lesson was that overnight batches need mid-batch sampling logged against clock time.
Practical stability checks include:
- Mid-batch dimensional sampling — measure every 30–50 parts, not just first and last
- Tool wear tracking — record cumulative cutting time per tool, correlate to dimensional drift
- Thermal monitoring — extended cuts can heat fixtures enough to shift setup by tens of microns
- Post-cut dimensional plots — a scatter plot of dimensions vs part number reveals drift patterns that averages hide
Dimensional stability is where 흑연 절단 수율 향상 stops being about the cut and starts being about the manufacturing system around the cut.
Yield Lever 3: Surface Integrity
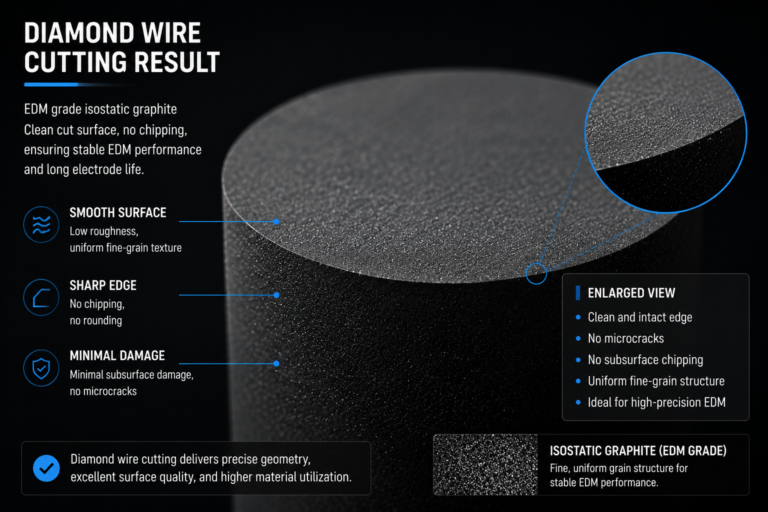
Surface defects — micro-cracks, chip-outs, edge burrs, and fracture zones — cause yield losses that never appear in dimensional inspection. A part can measure within tolerance but fail visual or downstream integration inspection because of surface issues.
For most graphite grades used in industrial applications, surface integrity depends on the interaction between cutting speed, tool sharpness, and feed rate. Aggressive feeds on softer graphite grades produce chip-outs that render parts unusable for their intended application. Conservative feeds on harder grades may not chip but generate excessive tool wear that later causes dimensional drift — an example of the trade-off that makes yield improvement harder than any single-variable optimization.
Micro-cracks are the hardest to catch because they may not surface until downstream stress or thermal cycling. Some manufacturers accept surface defects at the cutting stage and rely on downstream inspection, but this shifts yield loss from cutting to later stages — the total yield problem does not disappear, it just changes categories. See 흑연 가공 중 표면 손상 관련 논의를 참조하십시오.
수율 레버 4: 배치 일관성 (숨겨진 문제)
단일 부품 수율은 거의 항상 배치 수율보다 높으며, 이 차이에서 대부분의 흑연 작업에서 손실이 발생합니다. 처음 10번의 절단에서 95%의 양품을 생산하는 공정도 200번째 절단에서는 75%의 양품을 생산할 수 있습니다. 그 이유는 실시간으로 항상 명확하지는 않습니다.
배치 수율 감소의 동인은 일반적으로 다음을 포함합니다.
| 일관성 요인 | 배치 수율에 대한 일반적인 영향 |
|---|---|
| 공구 마모 (치수 드리프트) | 공구 수명 동안 5–15% 수율 손실 |
| 고정구 크리프 (설정 이동) | 배치당 3–8% 수율 손실 |
| 냉각수 오염 또는 고갈 | 냉각수를 방치했을 때 2–6% 수율 손실 |
| 열 드리프트 (긴 생산 실행) | 확장된 배치에서 2–5% 수율 손실 |
| 작업자 변동성 (다중 교대 작업) | 교대 근무 간 3–10% 수율 편차 |
배치 수율을 개선하기 어렵게 만드는 것은 복합적인 효과입니다. 네 가지 요인 각각에서 3%의 수율 손실이 발생한다고 해서 12%가 되는 것은 아닙니다. 요인 간의 상호 작용은 제어되지 않는 작업의 경우 실제 손실을 20% 이상으로 밀어 올릴 수 있습니다. 이것이 단일 변수 최적화 캠페인이 종종 실망스러운 이유이기도 합니다. 하나를 수정하면 다른 것이 확장되어 공간을 채웁니다.
배치 일관성 작업을 위해 관련 논의 흑연 제조 안정성 수율 유지에 직접 적용되는 공정 제어 기본 사항을 다룹니다.
흑연 절단 수율을 체계적으로 추적하고 진단하는 방법
수율을 개선하기 전에 신호를 노이즈와 분리하는 방식으로 측정해야 합니다. 가장 흔한 실수 흑연 절단 수율 향상 프로젝트는 기준선 없이 일화적인 수율 문제를 추적하는 것입니다.
수율 기준선 설정 (4주 이동 데이터):
- 수율을 명확하게 정의 — 사용 가능한 출하 부품 ÷ 시작 재료 부피, “양호한 부품 ÷ 총 부품”이 아님”
- 제품 유형별 세분화 — 단일 수율 수치는 문제가 어디에 있는지 숨깁니다.
- 매일 추적하고 매주 검토 — 일일 수치는 노이즈를 보여주고 주간 평균은 추세를 보여줍니다.
- 컨텍스트 기록 — 공구 교체, 작업자 교대, 재료 배치, 고정구 설정
수율이 떨어지면 다음 순서로 진단하십시오.
- 먼저 치수 분포 — 부품이 대상 치수를 놓치기 시작했습니까, 아니면 항상 그랬습니까?
- 다음으로 표면 결함 패턴 — 새로운 결함 유형, 또는 더 높은 비율의 동일한 결함?
- 세 번째로 커프 드리프트 — 배치 중간에 커프가 드리프트하고 있습니까?
- 네 번째로 고정구 및 공구 마모 — 마지막 교체 이후 두 가지의 누적 시간
- 마지막으로 재료 배치 — 재료 변동성은 실제이지만 일반적으로 가장 작은 기여자입니다.
재료를 먼저 비난하려는 본능은 흔하지만 종종 잘못되었습니다. 와 같은 평판 좋은 흑연 공급업체 SGL Carbon 그리고 Toyo Tanso 은 엄격한 공차로 재료 사양을 게시합니다. 재료 중심 수율 손실은 일반적으로 배치 내의 점진적인 드리프트가 아닌 배치 수준의 이동으로 나타납니다.
흑연 절단 수율 개선의 비용 영향
월 1,000kg의 흑연을 처리하는 작업에서 5%의 수율 개선은 50kg의 회수된 재료를 의미합니다. 그러나 실제 비용 영향은 해당 재료가 운반하는 가치 밀도에 따라 달라집니다. 저등급 흑연 회수는 킬로그램당 수십 달러로 측정됩니다. 고등급 등방성 흑연은 반도체 응용 분야의 경우 수백 달러로 측정될 수 있습니다.
수율 개선은 커프 감소와 함께 복합적으로 작용합니다. 고가 흑연에서 5%의 수율 증가와 10%의 커프 감소는 일반적으로 재료 비용 절감으로 이어져 회계 분기 내에 공정 개선 투자를 회수할 수 있습니다. 그러나 이는 공정이 충분히 오래 유지되어 절감이 누적될 수 있는 경우에만 해당됩니다. 이것이 지속 작업(문서화된 절차, 작업자 교육, 통계적 공정 제어)이 일회성 기술적 승리보다 더 중요한 이유입니다.
비용 절충을 평가하는 구매 팀의 경우 실질적인 의미: 시간당 2% 더 높은 비용으로 3% 더 높은 수율을 제공하는 공급업체 또는 공정이 총 재료 비용에서 일반적으로 승리합니다. 수율 경제는 최저 시간당 가격을 거의 선호하지 않습니다. 당사의 저커프 흑연 절단에 대한 P4 기둥 을 참조하여 전체 비용 측면을 확인하십시오.
현실적인 수율 개선 목표
기본적인 공정 제어가 적용되는 작업의 경우, 3개월 목표로 커프 제어 및 일관성 작업을 결합하여 3–8%의 배치 수율 개선이 현실적입니다. 더 큰 이득은 일반적으로 공정 조정이 아닌 장비 또는 고정구 재설계가 필요합니다.
기본적인 제어가 없는 작업의 경우 (수율 기준선 없음, 치수 추적 없음, 공구 마모 기록 없음) 처음 30~60일은 이득을 쫓기보다는 가시성을 확보하는 데 집중해야 합니다. 측정할 수 없는 것을 개선하려고 하면 잘못된 승리를 얻고 실제 문제를 숨기게 됩니다.
실용적인 엔지니어링 판단: 이번 분기에 하나의 레버만 작업할 수 있다면 batch consistency, 평균 케르프가 아닙니다. 케르프 표준 편차를 30% 줄이면 일반적으로 평균 케르프를 10% 줄이는 것보다 수율이 더 많이 향상됩니다. 수학은 직관적이지 않지만 현장 증거는 일관됩니다.
수율 개선 작업을 위한 관련 자료
- 저케르프 흑연 절단 기둥 — 케르프 손실의 비용 및 경제적 프레임워크
- 흑연 절단에서 케르프 손실을 줄이는 방법 — 케르프 레버에 대한 운영 방법
- 흑연 가공 표면 손상 — 표면 무결성 실패 모드
- 흑연 제조 안정성 — 배치 일관성을 위한 공정 제어 기본 사항
흑연 절단 작업의 직업 안전 고려 사항은 다음을 참조하십시오. 먼지 노출에 대한 호흡기 보호에 관한 OSHA 지침.
자주 묻는 질문
흑연 절단에 대한 좋은 수율률은 무엇입니까?
수율률은 재료 가치와 절단 형상에 따라 다릅니다. 정밀 응용 분야의 고가 흑연의 경우 배치 수율이 85% 이상이면 일반적으로 양호한 것으로 간주됩니다. 75% 미만은 일반적으로 재료 문제보다는 공정 제어 문제를 나타냅니다. 절대적인 수치는 공정이 안정적인지 여부보다 덜 중요합니다. 82%에서 일관되게 실행되는 작업은 70%와 90% 사이를 오가는 작업보다 개선하기 쉽습니다.
케르프 감소가 수율 개선과 동일합니까?
아니요. 케르프 감소는 하나의 레버이지만 수율은 치수 안정성, 표면 무결성 및 배치 일관성에도 의존합니다. 일관성을 개선하지 않고 케르프를 줄이는 것은 수율을 크게 이동시키지 못합니다. 우리의 경험에 따르면 케르프를 개별적으로 최적화하는 팀은 케르프 손실이 가리고 있던 일관성 문제를 드러내기 때문에 실망스러운 수율 수치를 보는 경우가 많습니다.
배치 수율이 단일 부품 수율보다 낮은 이유는 무엇입니까?
Because single-part yield captures your best process moments, while batch yield includes tool wear, fixture drift, and coolant changes. Batch consistency is the harder problem — first-article success proves the process is capable in ideal conditions; batch yield proves it is capable in production conditions. The gap between the two is your consistency problem.
How do I diagnose a yield drop?
Start with the sequence: dimensional distribution → surface defect pattern → kerf drift → fixture and tool wear. Do not start with material — material is usually the last cause, not the first. Instinctively blaming material feels productive but rarely finds the real cause. Fixture creep and coolant issues are the two causes we see most often in operations that jumped to “the material must be inconsistent.”
What yield improvement is realistic in 3 months?
For most operations with basic process control already in place, 3–8% batch yield improvement is a realistic 3-month target through kerf control and consistency work. Larger gains typically require equipment or fixture redesign. Operations without any process control baseline should spend the first 30–60 days establishing visibility rather than chasing gains — you cannot improve what you do not measure.