A block of isostatic graphite is quoted, cut, and delivered as finished parts — and somewhere between the block invoice and the finished part inventory, a meaningful share of the material becomes kerf dust, trim, and offcuts. That gap is the graphite material utilization rate, and it is often invisible to procurement because the cost sits on the operations budget line, not the material line. It looks like a process problem. It behaves like a purchasing problem.
This page is written for the procurement side of the decision, not the operator side. It covers how utilization rate is actually defined, why the same “utilization” number can mean very different things in a quote, and how to weigh utilization pressure across grades of different value. If you are looking for how to reduce kerf on the operator side, see how to reduce kerf loss in graphite cutting.
What Graphite Material Utilization Rate Actually Measures
Material utilization rate = (mass or volume of usable parts) ÷ (mass or volume of the input block). Simple in definition, inconsistent in practice.
The number a supplier quotes and the number your finance team sees are frequently different, because there is no universal standard on how to count three edge cases:
- Trim allowance — the outer skin of a graphite block that gets removed to reach dimensional or grain-orientation specification. Some quotes count this as “input consumed,” others count it as pre-cutting waste (excluded from the utilization calculation entirely).
- Kerf loss — the material turned into dust by each cut. This is usually the largest single loss category in slicing operations and the one that a low-kerf process directly reduces.
- Rework and scrap — parts that fail dimensional or surface inspection. Some suppliers report utilization based on “cut” output; others report based on “shipped” output after QC rejection.
A graphite material utilization rate that excludes trim and counts cut output is not comparable to a number that includes trim and counts shipped output. The second number represents materially more actual recovery for the same headline percentage. If your quotes come from different suppliers with different definitions, the “better” utilization number may be worse in real material terms.
For procurement, the practical rule: ask suppliers to define utilization on the same basis before comparing. Two quotes on the same nominal percentage can differ significantly once the definitions are aligned, and a lower headline number on a stricter definition often beats a higher headline number on a looser one.
Where the Material Actually Goes
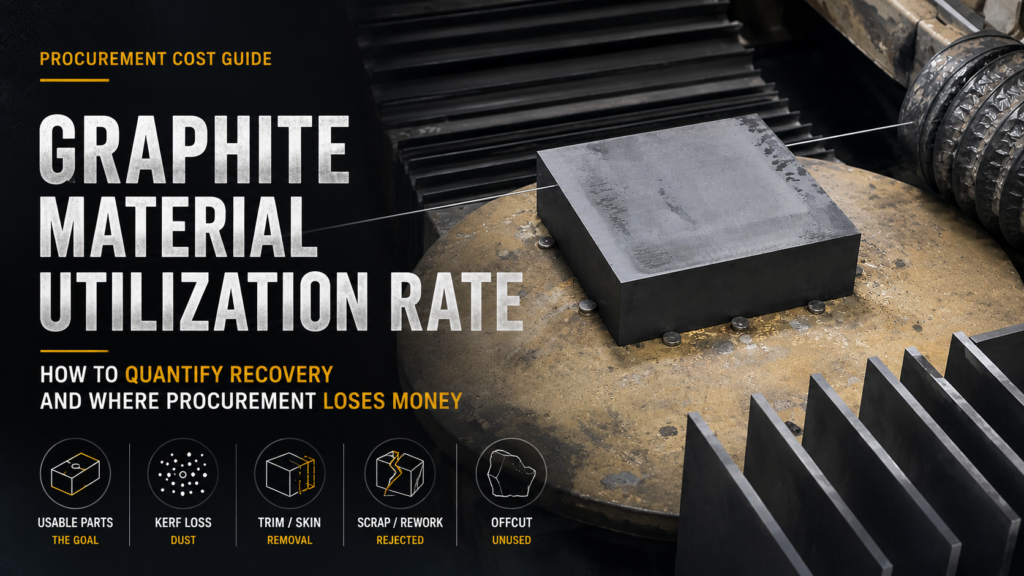
Material loss on a graphite cutting job falls into four categories:
- Kerf — the width of each cut, turned into dust
- Trim / skin removal — the outer layer of the block removed to reach specification
- Rework and scrap — parts rejected at QC
- Handling and offcut — end pieces, jig contact zones, non-productive cuts
The relative share of each depends on grade, geometry, and process control. In slicing operations with high cut counts, kerf usually dominates because a block being sliced into many parts eats kerf many times. A block being sliced into 30 parts eats kerf 29 times; a block being sliced into 100 parts eats kerf 99 times. This is the arithmetic reason graphite material utilization rate is more sensitive to kerf width than to any other single variable when the part count is high, and why the cost impact of kerf reduction compounds on high-volume runs.
Trim and skin removal are grade-dependent, not process-dependent. Grades that require specific grain alignment or tight microstructure control often need more aggressive skin removal to reach specification. This is a fixed cost of using premium grades, not something a better cutting process can recover.
Rework and scrap losses tell you about process control, not material. Blocks with high rework losses usually have kerf loss under control but dimensional consistency out of control — see graphite cutting yield improvement for the yield side of the equation.
How Configuration Changes the Math
Graphite material utilization rate is not a property of the graphite. It is a property of the cutting configuration applied to that graphite. The same block cut two different ways produces materially different recovery numbers.
The dominant driver is the ratio of kerf width to part thickness. A 1.0 mm kerf against a 20 mm part is a 5% loss per cut. The same kerf against a 5 mm part is a 20% loss per cut — four times the proportional loss for the same physical kerf. This is why utilization drops sharply on thin-part production: kerf is a fixed cost per cut, and part thickness is the variable it competes against.
For thin-part production, moving to thin kerf graphite slicing is often the largest available utilization gain, provided the grade and geometry support it. The gain is not universal — thin kerf slicing on coarse-grain grades or very deep blocks can produce worse utilization than standard kerf because parameter sensitivity increases rework and scrap.
For complex geometries — mixed contour cutting plus straight slicing — straight utilization rate can mislead. A contour cut that produces a curved offcut consumes more material than a straight slice, but that offcut may be usable input for a smaller downstream part. Some operations track “primary utilization” (usable output from the intended part) separately from “secondary utilization” (usable material recovered from offcuts for other parts). Combined recovery can be meaningfully higher than primary utilization alone suggests, but only if the operation actually has downstream demand for the offcut geometries.
The Cost Math Procurement Needs to See
Utilization rate expressed as a percentage is not directly comparable across grades, because grade cost varies by an order of magnitude between general-purpose and high-end isostatic material. The comparison procurement needs is dollar loss per finished part, not percentage loss per block.
Worked example — hypothetical numbers to show the arithmetic, not empirical benchmarks. Two graphite grades, same target part, same cutting operation:
- Grade A: general-purpose, low unit cost, high utilization
- Grade B: high-end isostatic, high unit cost, moderate utilization
If Grade B costs several times more per kilogram than Grade A, a 5-percentage-point utilization improvement on Grade B saves several times more dollars per part than the same improvement on Grade A. If the operation runs at volume, that difference compounds into a real annual budget number — enough to justify significant process investment in kerf reduction, monitoring, or wire quality on the high-value grade.
This is the reason graphite material utilization rate matters most on the highest-value grades, and why procurement pressure on utilization should be weighted by grade value, not applied uniformly. Chasing marginal utilization gains on the cheapest grade is often a distraction. The same effort applied to the most expensive grade is where the money is.
For a general view of material loss economics across cutting and machining alternatives, see material loss in graphite machining.
What a Realistic Utilization Target Looks Like
There is no single target that applies across grades and geometries, and any specific percentage a supplier quotes should be checked against how they define input, output, and QC rejection.
The correct starting point is not a target percentage — it is a first-principles calculation for the specific job. Given the part thickness, block dimensions, and kerf width the process will actually run at, the maximum theoretical utilization can be computed directly. Real-world utilization will land below that theoretical ceiling because of trim, rework, and handling losses. The gap between theoretical maximum and actual delivered is what process control determines.
If a supplier reports utilization significantly above the theoretical ceiling for the geometry, the definition is wrong somewhere — usually trim being excluded from the input side. If a supplier reports utilization significantly below the theoretical ceiling, the process control issue is likely tension drift, tool wear management, or dimensional monitoring rather than kerf width. Reference process characteristics in precision graphite slicing for baseline expectations across configurations.
Sometimes the right answer is a different grade selection or a different part geometry, not a better cutting process. Grades and geometries that inherently sit at low utilization in the first-principles calculation should not be forced higher through supplier pressure — they should be reconsidered at the specification stage.
Where Procurement Commonly Loses Money on Utilization
Three recurring patterns cost operations material margin, all of them decisions made upstream of the cutting floor.
Specifying the highest-grade material for parts that do not require it. Grade uplift from general-purpose to premium isostatic can be several times the material cost. If the finished part does not require the isostatic microstructure, that cost is unrecovered utilization loss the moment the block is purchased. This is not a cutting problem. It is a specification problem, and it usually originates in engineering rather than procurement.
Ordering block sizes that do not match cut layouts. Standard block dimensions and target part dimensions do not always nest cleanly. Ordering a block that is meaningfully taller or wider than the intended cut plan builds waste into the job before cutting begins. Some suppliers offer custom-cut blocks that match downstream cut plans; the added supplier cost is often less than the material loss avoided, especially on premium grades.
Comparing suppliers on unit price rather than delivered part cost. A supplier with a lower block price and worse utilization delivers higher net cost per finished part. Procurement systems that track unit price of the input but not the delivered cost per output part optimize the wrong number. This is one of the most common ways premium graphite operations lose margin without knowing it, because the loss shows up on the operations line, not the material line.
For the pillar-level view of why kerf is the most expensive controllable variable across the graphite cutting cost stack, see low-kerf graphite cutting. Grade-specific characteristics that affect utilization at the material level are documented in SGL Carbon’s specialty graphite catalog and Toyo Tanso’s material data sheets, which are the reference points procurement can use to check grade selection against actual application requirements.
FAQ
How is graphite material utilization rate calculated?
It is the ratio of usable output to input, expressed as a percentage. The complication is that “usable output” and “input” are defined differently across suppliers. Some exclude pre-cutting trim from the input side; some report cut output rather than QC-passed shipped output. When comparing quotes, force the calculations onto the same basis — typically shipped output over full input block mass — before drawing conclusions.
What is a good graphite material utilization rate?
There is no universal target. The correct benchmark is the theoretical maximum for the specific part thickness, block dimensions, and kerf width, minus a realistic allowance for trim, rework, and handling. Any percentage quoted without reference to that theoretical ceiling is difficult to evaluate. A high percentage that excludes trim can be worse in real terms than a lower percentage on a stricter definition.
Why is utilization rate lower on thin parts?
Because kerf loss is a fixed cost per cut, and thin parts require more cuts per unit of output. Slicing a 100 mm tall block into 5 mm parts requires 19 cuts; slicing the same block into 20 mm parts requires 4 cuts. With a 1 mm kerf, that is 19% of block height lost to kerf on the thin-part run versus 4% on the thick-part run — before any other losses. This is arithmetic, not process quality.
Does thin kerf slicing always improve utilization?
No. On grades and geometries where thin kerf slicing works, the gain is real. On coarse-grain grades, deep blocks, or operations without process monitoring, thin kerf slicing can produce worse utilization than standard kerf because parameter sensitivity increases rework and scrap. First-article validation on the specific grade and geometry is the correct way to confirm the gain before committing a production run.
Should procurement push for higher utilization from all suppliers?
Weighted by grade value, yes; uniformly, no. A utilization improvement on a premium grade delivers substantially more dollar impact than the same improvement on a low-cost grade. Concentrating utilization pressure on the highest-value grades is where the material budget moves. On low-cost grades, unit price competition and delivery reliability usually matter more than the marginal utilization percentage.